Wish to better track, monitor and measure your social media marketing performance on Facebook?
There is no better tool you can use that Facebook Insights – the free analytics tool available for any organisation with a Facebook Page.
This article will cover the basics of social media marketing metrics, and walk through some of the key sections of Facebook Insights. To benefit from this, you should have an existing Facebook Page that is fairly active with a fan base.
Now before we dive into Facebook Insights proper, let us first look at how social media performance can be measured while mapping your customer’s journey through the digital marketing funnel.
How To Measure Social Media Performance
Before we dive into your social media analytics, you need to first determine what your objectives and accompany Key Performance Indicators (KPIs) or metrics are.
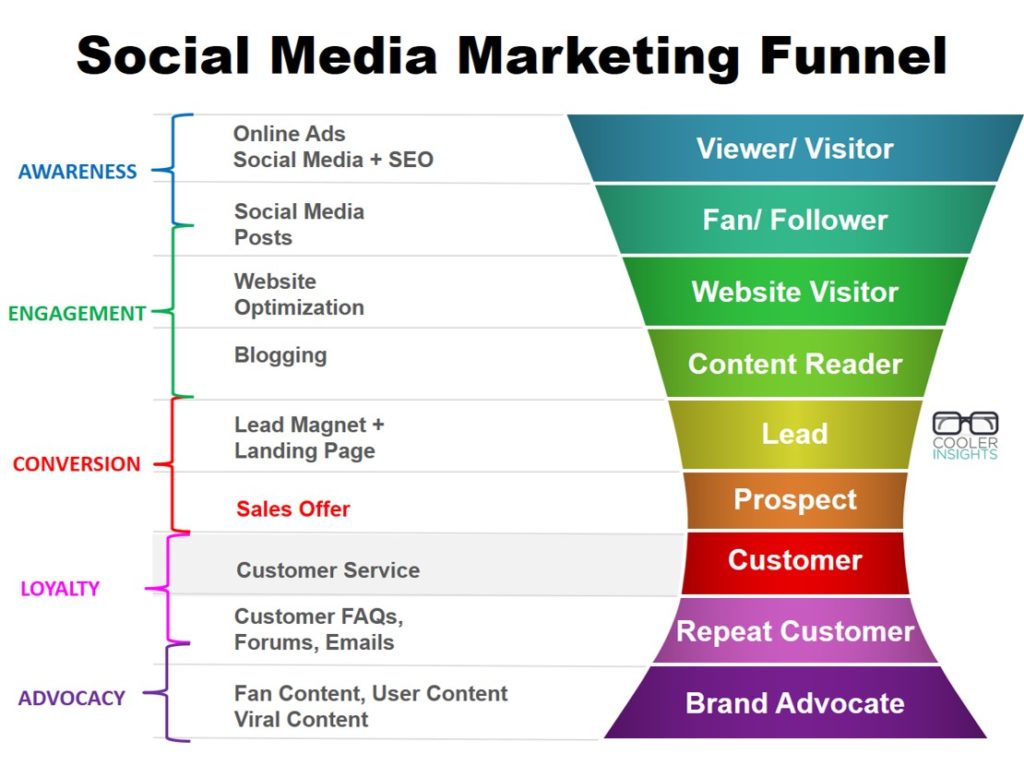
In social media marketing, we normally zoom in to 4 or 5 objectives depending on the customer stage which you’re addressing. These can be measured via the following analytics and indicators:
- Awareness: page views, impressions, visitors, reach, no of fans/followers, video views (eg 3 secs), and impressions/reach per post or views per post
- Engagement/Consideration: likes, comments, shares, clicks, longer video views (eg 30 secs), and average engagement rate per post or per follower
- Conversion: opt-ins, sign ups (for events), downloads, subscriptions, and purchases
- Loyalty/Advocacy: shares, retweets, fan blog posts, influencer posts, fan growth
These different “touch-points” can be represented by a digital marketing funnel which traces your customer journey as he or she progresses towards a deeper and more committed relationship with your business.
To read some of these Facebook numbers, you can use an analytics tool like Facebook Insights, which will track how well your Facebook page is doing, as well as Google Analytics for the actions taken on your website.
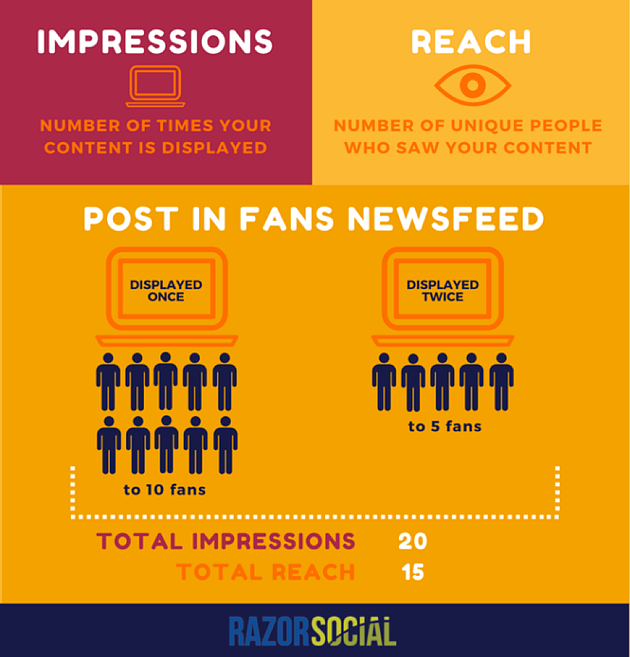
Oh yes, before we proceed, note that Reach and Impressions are slightly different metrics of Awareness. This infographic from Razor Social shows you the difference between the two:
What Facebook Insights Does
Before we dive into the interface of Facebook Insights, let us first look at what it helps you with.
A free analytics tool provided by Facebook, Insights helps you to monitor the performance of your Facebook Page, and provides valuable data to help you improve how you manage your posts and fans.
From Facebook Insights, you can read and interpret the following analytics info:
- How effective your Facebook Page is in growing fans, engaging them, and making them stick around
- How well different types of content work work in generating a desired action; be it video views, reach, likes and reactions, comments, shares or clicks
- How well different posts work as well as their engagement rates
- What the best times are for you to publish content based on your fan activity
- Who your fans are in terms of demographics, location and engagement
Overview of Facebook Insights
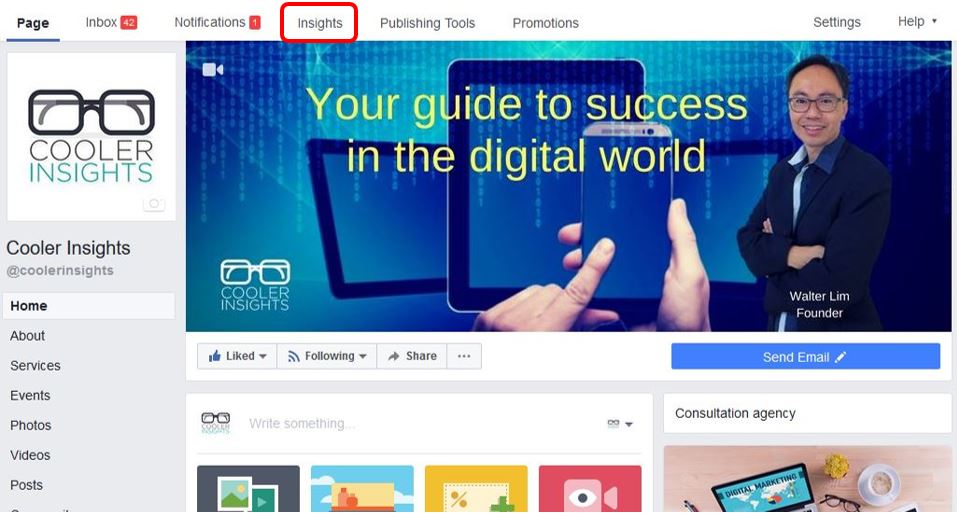
To gain access to your Facebook Insights, click on the tab above when you are on your Facebook Page.
Once you have done so, you’ll see a screen which provides an Overview of your main Facebook Page analytics. If you click on the ‘Last 7 days’ section next to Page summary, you can toggle your dashboard to Today, Yesterday, Last 7 Days, or Last 28 Days.
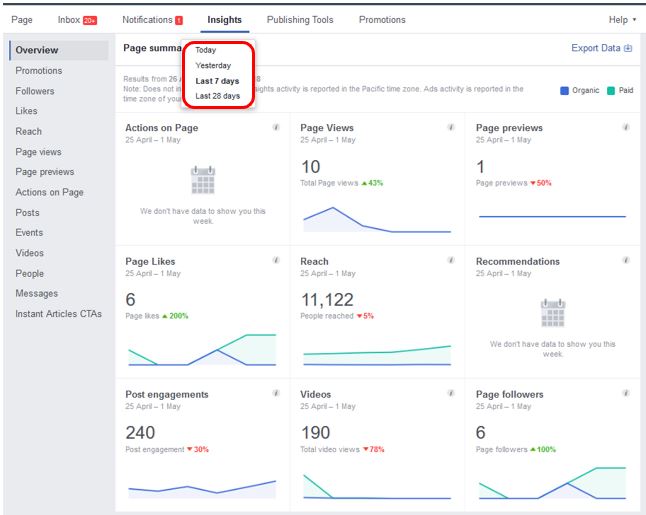
Let us look at each of these indicators in turn:
- Actions on Page: This tracks the number of clicks on your contact information or your CTA buttons on posts (eg Download, Shop Now, Learn More, etc)
- Page Views: The number of times your profile has been viewed by people who logged in and logged out of Facebook. Its a useful indicator of Awareness for your page.
- Page Previews: The number of times people hover over your page profile or page name to see a preview of your page.
- Page Likes: Here, you can look at the number of new people who have liked your page (ie fans), broken down by paid (ie using advertising) or non-paid (ie organic).
- Reach: The number of people who have any posts from your page on their screens, broken down by total, organic and promotion (ie paid).
- Recommendations: The number of times people have recommended your page.
- Post Engagements: The number of times people have engaged with your posts, broken down by likes/reactions, comments, shares, clicks and more.
- Videos: The number of times your page videos have been viewed at least 3 seconds, broken down by total, paid or non-paid.
- Followers: The total number of new people who followed your Page, broken by paid or non-paid.
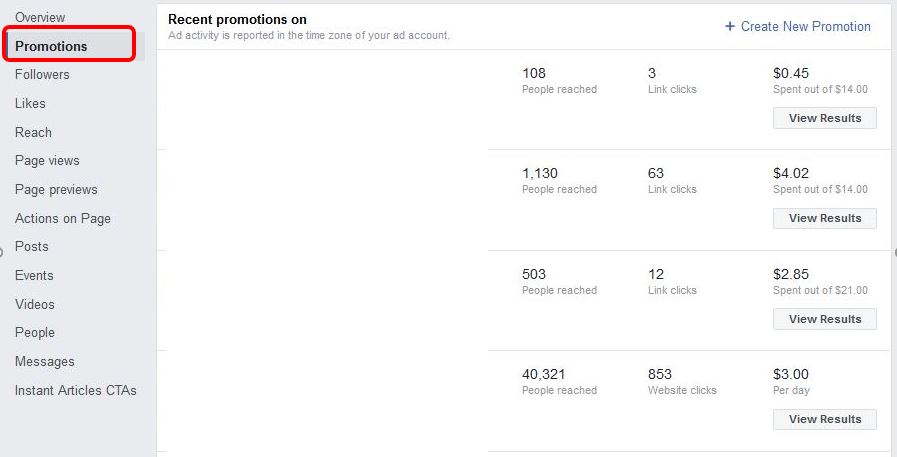
Recent Promotions
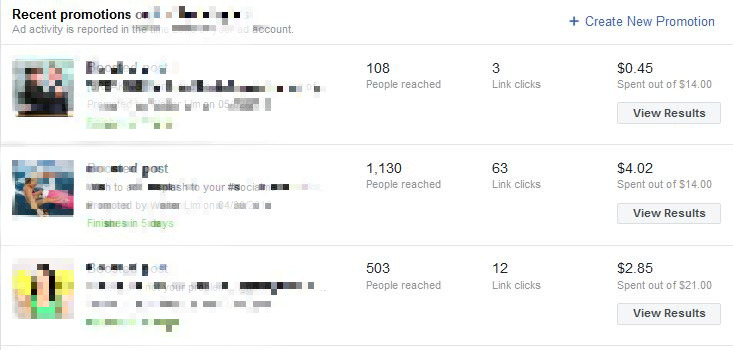
When you scroll down the Overview page, you’ll also see some of your Recent Promotions (see below), as well as your Most Recent Posts. This provides a quick overview of how well your recent promotions (ie paid posts which you’ve boosted) and posts (both paid and non-paid) have performed.
Useful Tool: Pages to Watch
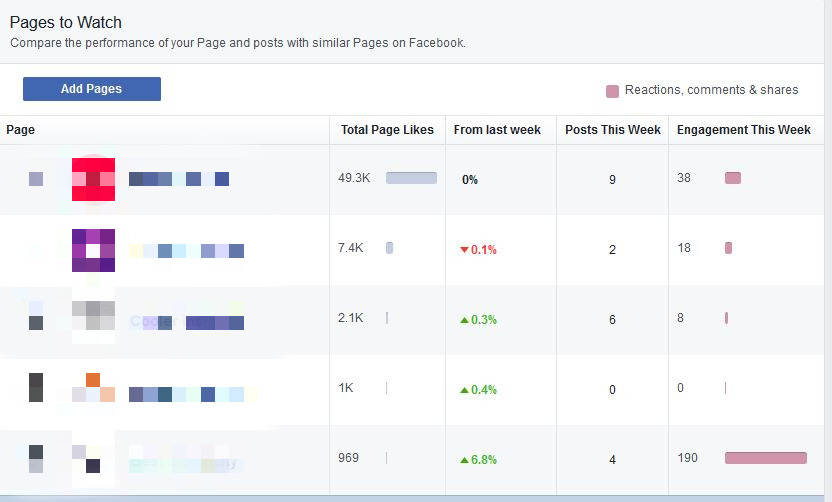
If you scroll further down this page you’ll see the section called Pages to Watch (see below).
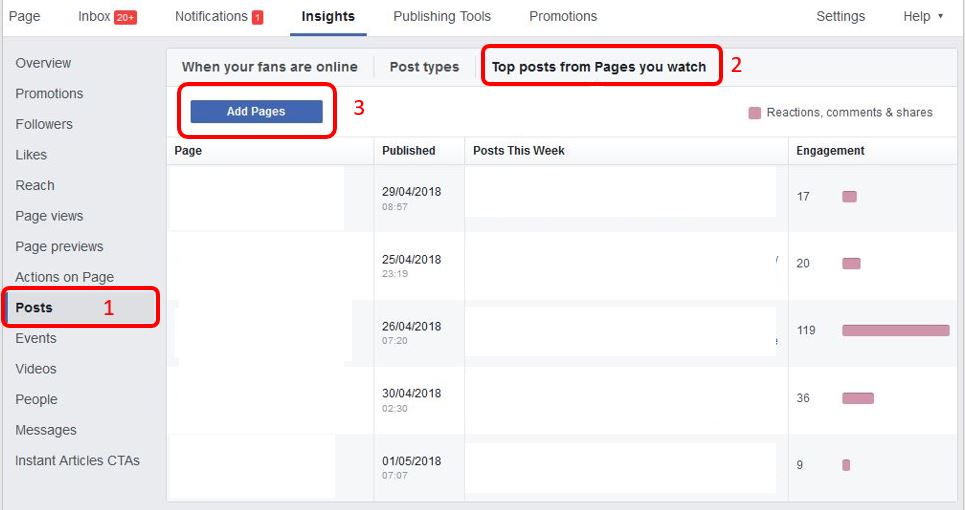
This latter feature is pretty useful, and can be accessed by first clicking the following steps:
- Click on ‘Posts’ on the left nav bar
- Click on Top posts from Pages you watch
- Click on Add Pages
Beyond the overview of these Pages from the “Overview” tab, you can also monitor the posts which they have published as well as the engagement for each of these posts!
This is a great way for you to benchmark your page against other pages in terms of your performance per post (versus theirs) as well as to learn what their best posts are over a regular time period.
(For the purposes of confidentiality, I have blanked out the details of each posts.)
Measuring Your Promotions
Let us now move to the next tab which is called Promotions. This is where all your Boosted Posts results are measured as shown below.
If we click on the “View Results” button for one of these promotions, we can see how they perform as shown here. For this example, we reached a total of 2,063 people for a sum of $14 over 7 days, generating 48 clicks in total.
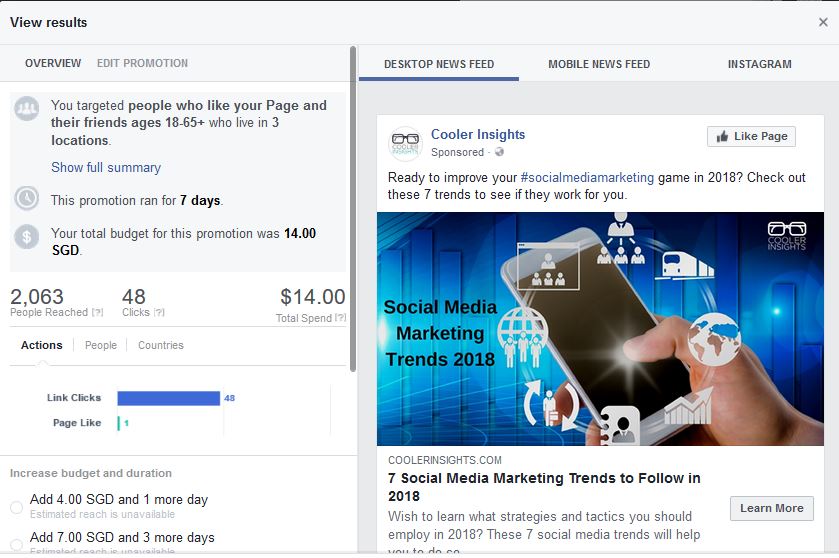
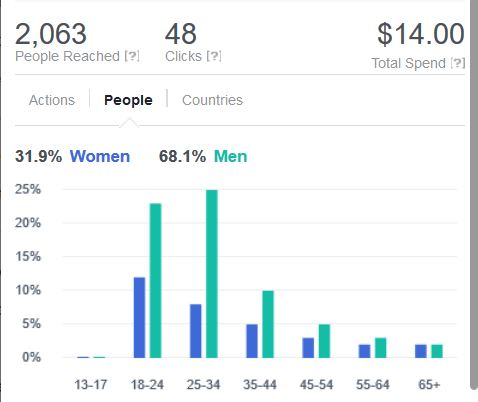
If you click on the ‘People’ tab on the ‘View Results’ button, you can see the breakdown of the age and gender for this promotion. It seems quite obvious that men are more interested in social media marketing trends than ladies!
If you wish, you can also click on ‘Countries’ to see how well your promotion worked among different countries.
IMPORTANT: If you used the Facebook Ads Manager to amplify your Facebook Posts, the results for those efforts will be tracked on Facebook Ads Manager and not here on Facebook Insights.
Evaluating Your Promotions
Assess which promoted posts do better than others, and do more of those.
If you see that people in a certain demographic or location seem to engage more with your posts, you can consider narrowing your audience when you boost your post.
Beyond the quantitative analytics as shown above, do also look out for the following:
- Cost Per Result (eg Cost Per Click, Cost Per Engagement, or Cost Per View)
- How the copy is written for the promoted posts as well as its length
- Types of visuals used in the promoted posts, be it a photo, video or infographic
- Topic/subject matter in the promoted posts. Do recent topics (ie using newsjacking) work well for your audience?
- The offer in the promoted posts, ie incentive for a reader to engage with the posts
Page Likes and Followers
The sections on Page Likes and Followers are similar, so we’ll just focus on Page Likes (ie fans) here. Note that you can’t target your Facebook Page followers as an audience (under Facebook Ads) but you can target your fans (ie Page Likes).
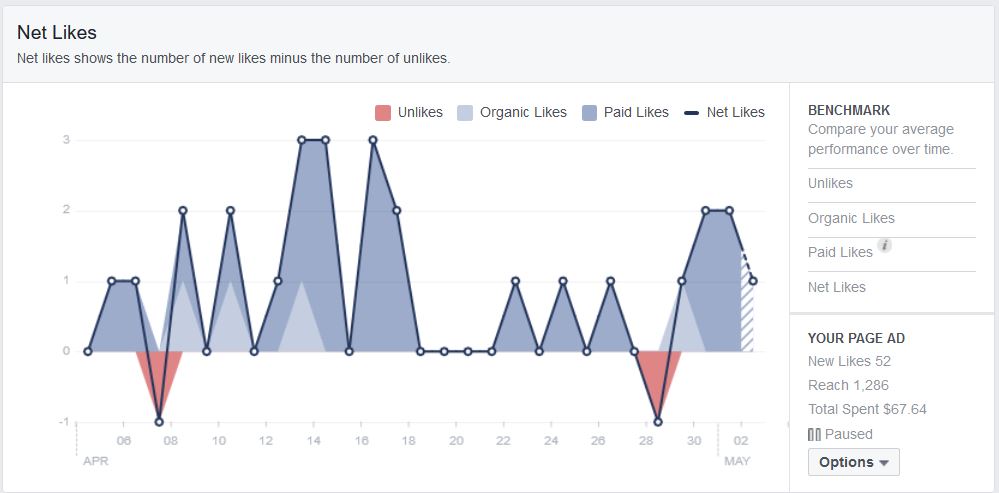
Here, you can see the growth in your fans over the period of time.
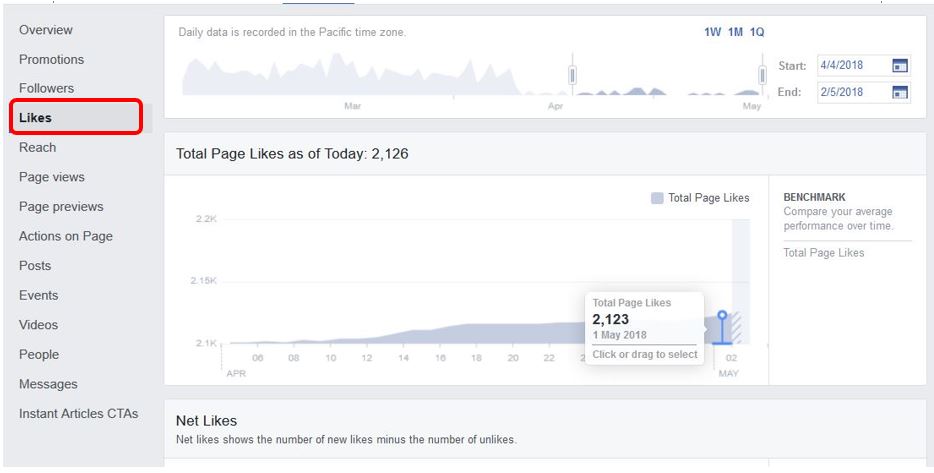
From the chart above, you can see the number of “Likes” per day, as well as the historic growth of fans. If you scroll down further, you can see the net number of Likes after taking away Unlikes from your page. The chart also shows how many are Paid Likes versus Organic Likes.
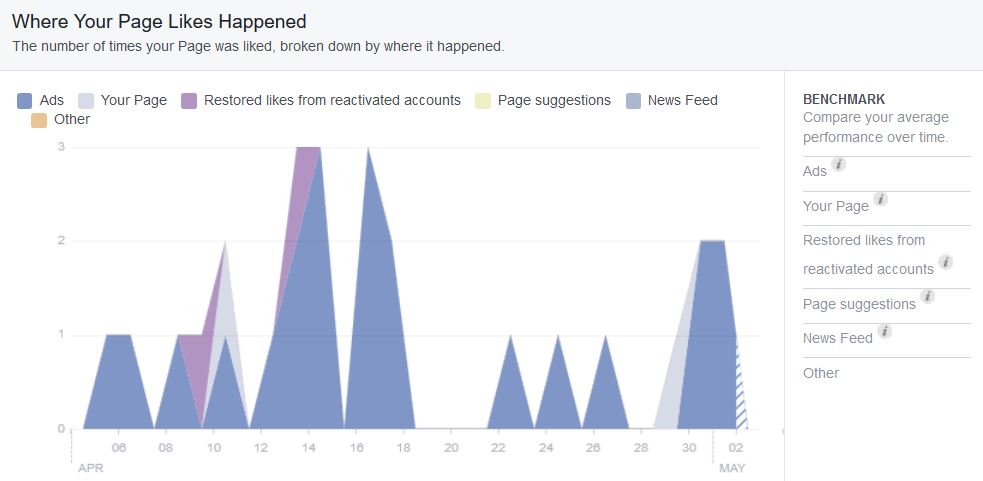
The next chart shows you where your Page Likes happen, be it from Ads, Your Page itself, Restored likes from reactivated accounts, Page suggestions, News Feed or other sources.
Do Page Likes Still Matter?
With Facebook’s algorithm making organic engagement virtually a thing of the past, the question arises whether it still makes sense to grow your fan base.
The answer is a definite “YES” although the actual number of fans matter far less than the quality of fans. Once you’ve got a comfortable number of fans, you can set up Custom Audiences and Lookalike Audiences when you do Facebook Ads, and target these audiences with more conversion focused ads.
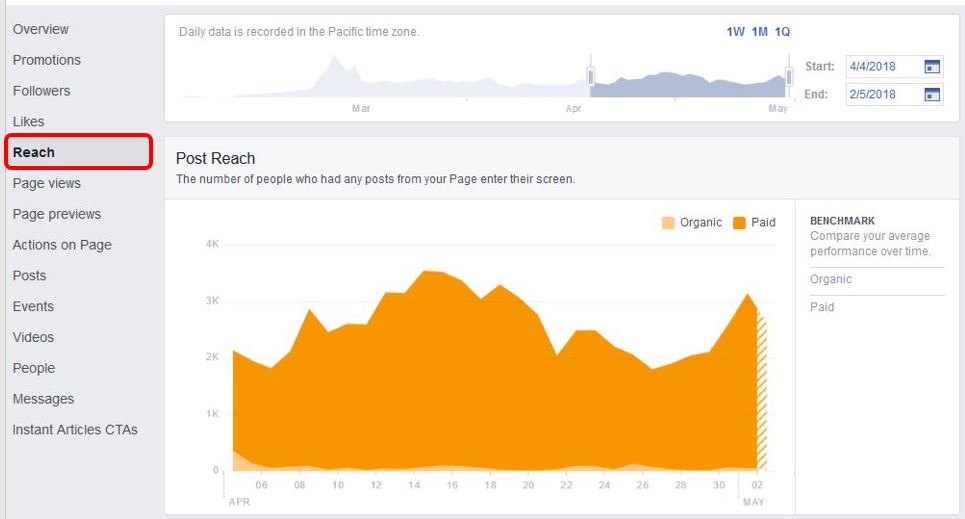
Post and Page Reach
Under Reach, you can determine what your Post Reach is like and learn how many people your posts have reached over the specified time period as shown.
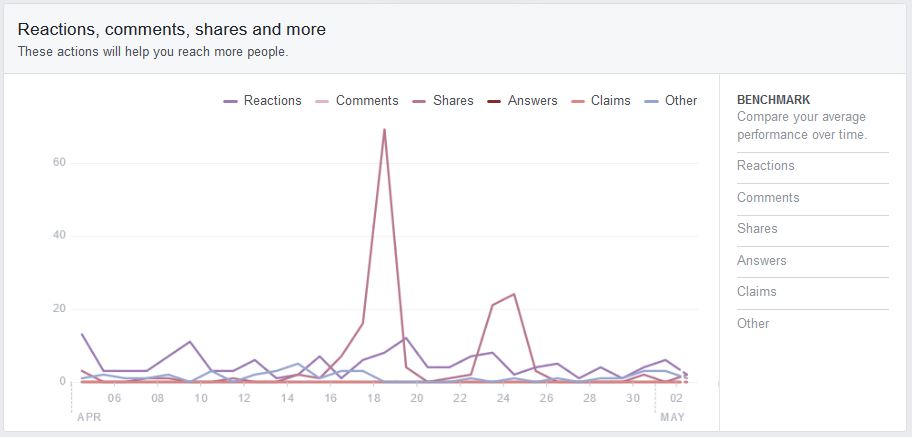
If you scroll down further, you can see other results like the Recommendations as well as the Reactions, Comments, Shares and other engagements on your posts.
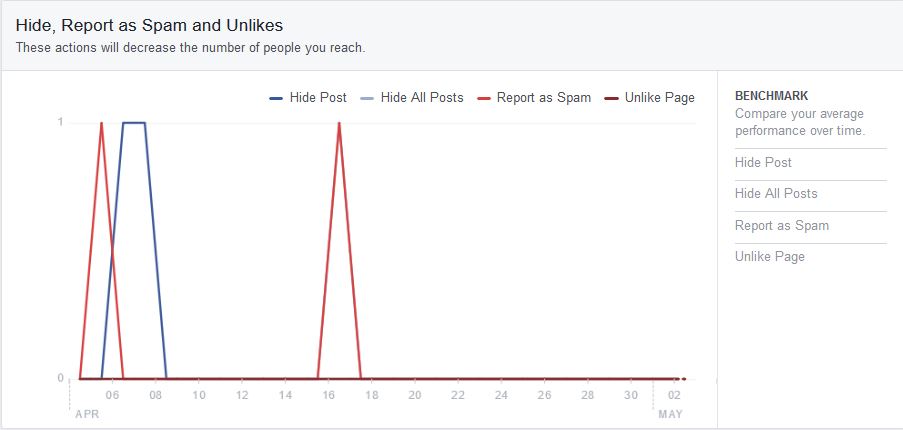
Further down, you can see all the negative responses to your page, ie people who have reported your page, unlike it, or hide a post.
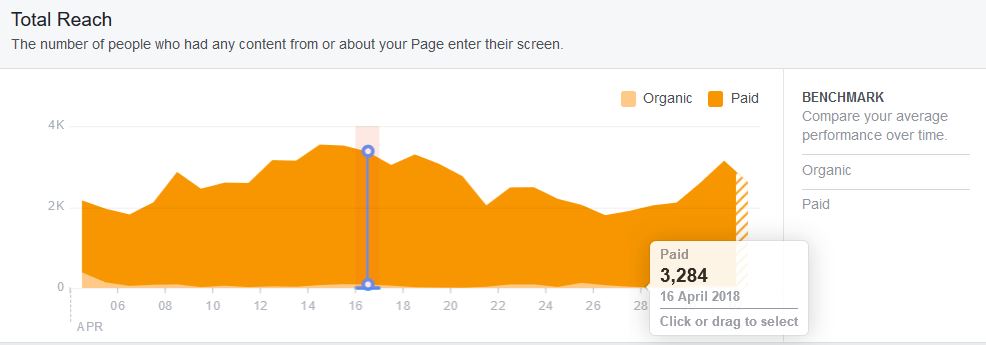
Finally, you can find the overall Page Reach, broken down into Organic and Paid. If you mouse over each section, you can get the detailed indicators for each day.
Posts Performance – Best Timings, and Post Types
Now perhaps the most important tab on Facebook Insights is the “Posts” tab which provides the following:
- When your fans are online (the best times of the day to post)
- Post types (the performance of different media types)
- Top posts from Pages you watch (see earlier section above)
- Published posts (performance of each published post)
Let us go through each section.
When Your Fans are Online
This shows you the best times of the day to post, based on your fan behaviours during different days of the week.
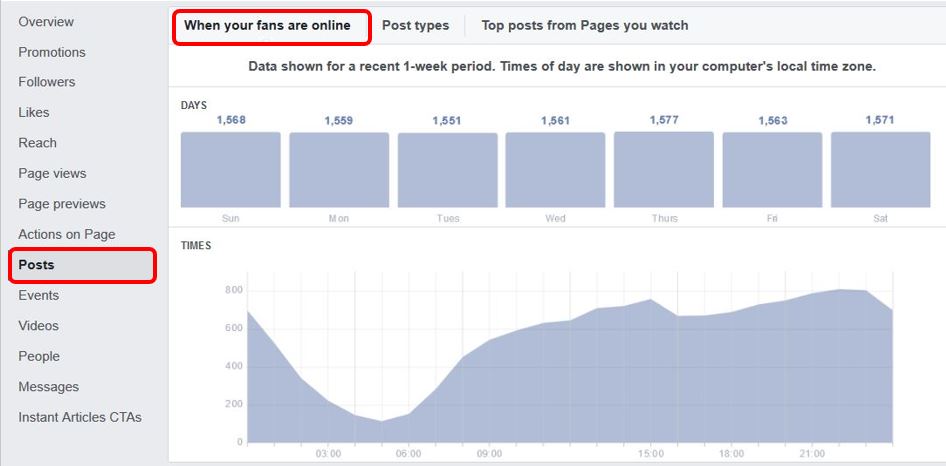
From the chart above, can you tell me which is the best and worst timings to publish a post?
Having said that, do note that while having a lot of fans online may result in more engagement for your posts, sharing your post in a popular time-slot may also result in a lot more competition. The trick here is to balance between both, and also consider the psyche of your fans during that time of the day.
Post Types
This shows you the performance of the different media types on your Facebook Page in terms of their Average Reach and Average Engagement.
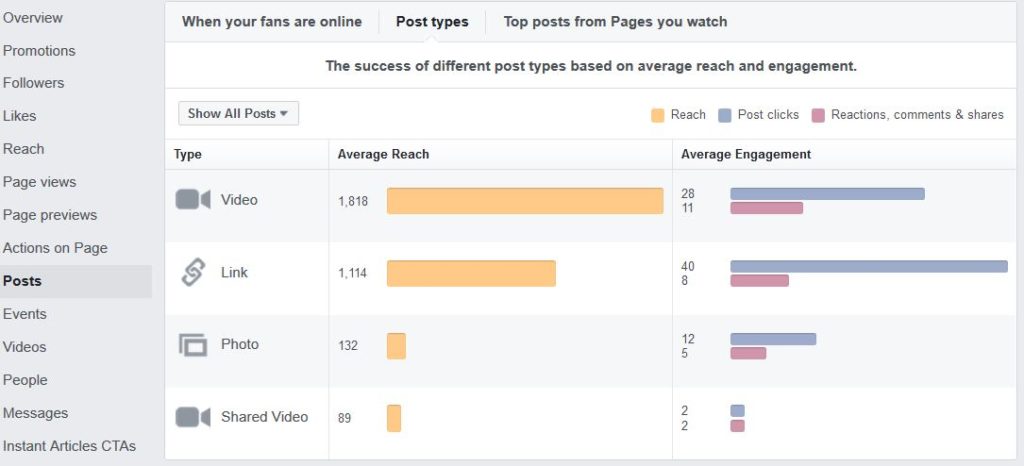
From the chart above, you can see that videos do seem to trigger better performance for this page vis-a-vis other forms of posts.
All Posts Published
This section reveals how well your posts perform in general, and includes various useful indicators such as the following:
- Types of post content (ie link posts, images, videos, etc)
- Reach of post, divided into organic/paid
- Total no of clicks on each post
- Total no of reactions, comments & shares on each post
- Whether the post is boosted (View Promotion) or organic
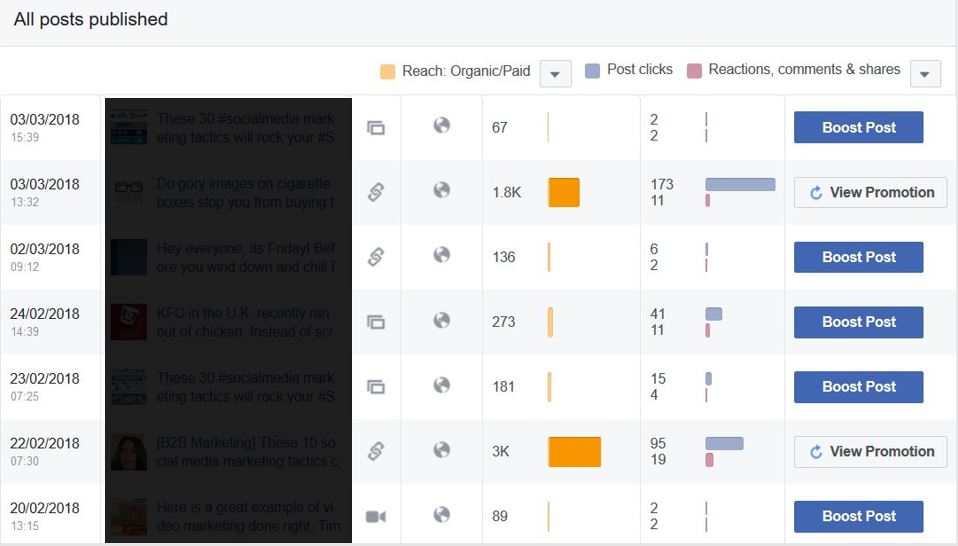
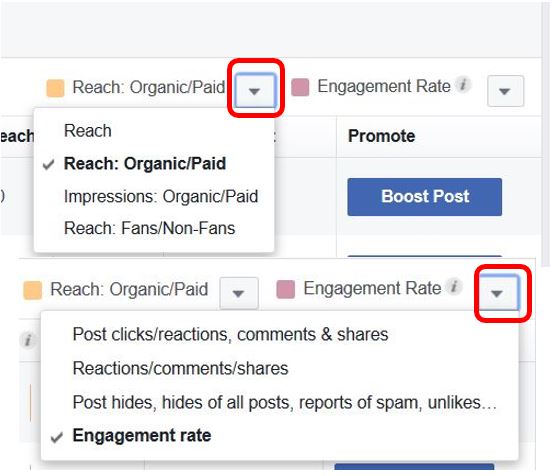
Here’s a cool tip. You can actually change how you display your performance by toggling the Reach and Engagement buttons below!
For Reach, you can toggle it to Impressions or breakdown between Fans and Non-Fans, while you can show different Engagement displays: Post clicks/reactions, comments and shares; Reactions/comments/shares; Post hides, hides of all posts, reports of spam, unlikes; and Engagement Rate.
If you click on one of the published posts, you’ll see the individual performance of that post, as shown below.
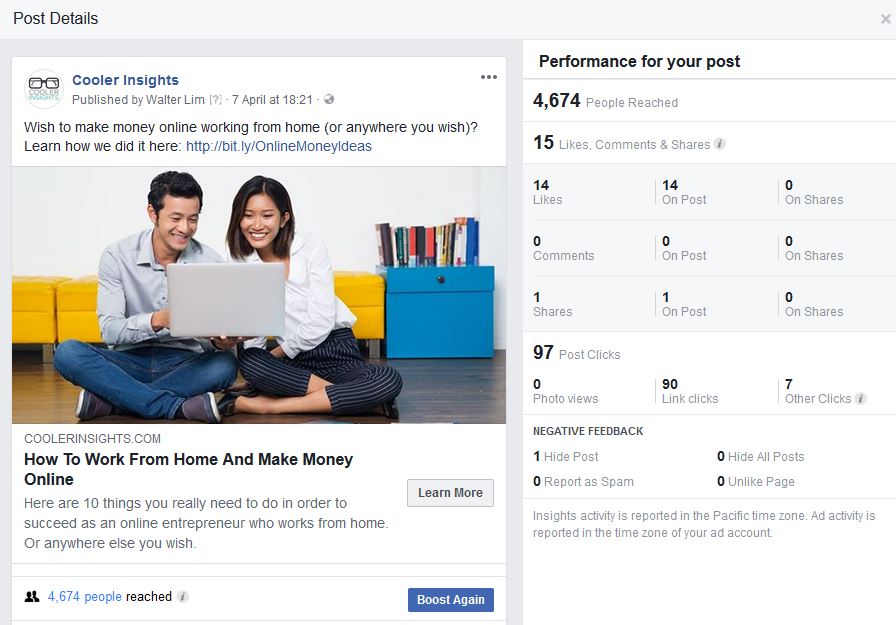
From this screenshot above, you can tell the following performance for the post:
- Total number of people reached
- No of likes and reactions
- No of comments
- No of shares
- No of post clicks (on the link and other areas)
- No of negative feedback
Videos Tab
Facebook has included a Videos tab to focus on your analytics for videos uploaded and shared on Facebook. You can see the times your page’s videos are viewed for 3 seconds or more here, and compare it against a corresponding period.
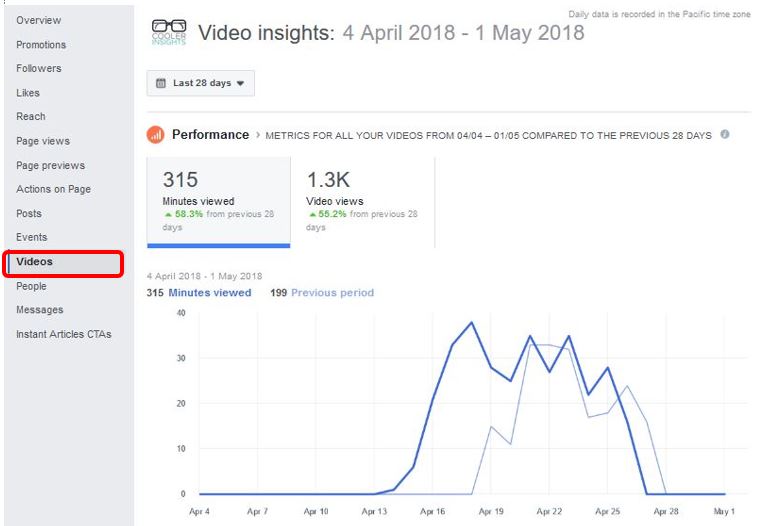
You can see from the chart above that the following are provided:
- Total number of minutes of videos viewed
- Total number of video views (ie 3 seconds and longer)
- Comparison of video views against the same period
Facebook also shows you a comparison of the top videos during that period.
People Tab
Finally, you can click on the People tab to see the composition and breakdown of your audience, by demographics, by country, city, language, people reached and people engaged as shown by the screenshot below.
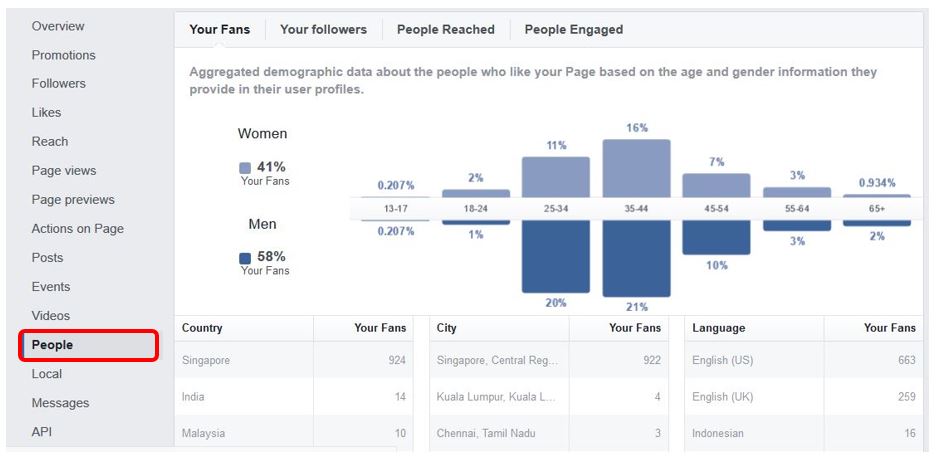
This gives you a useful oversight of the types of audiences whom you are attracting, as well as those whom you can reach and engage with more effectively.
Optimizing Facebook Performance
Phew! That was quite a lot of ground covered.
From the analytics that you’ve gleaned from Insights, you can adopt the following strategies:
- Choose the posts which perform best to boost, rather than boosting all posts equally
- Analyse the types of posts which perform better, and follow the styles used in those posts – copy, design, content types, and offers
- Publish your posts during the best times of the day to optimize your engagement
- Measure your engagement rates and see if you’ve managed to improve on your average engagement rate as time goes by
- See which videos do better, and consider producing and publishing more of those videos
- Refine your audience targeting based on the People who are engaging on your posts, and improve your results when you boost your posts.
I hope that this has been useful.
To advance your skills, do sign up for my social media marketing course. Or fill up our enquiry form if you need help to boost your company’s Facebook performance.