A lot of people shy away from Google Analytics, but in actuality, it is not as scary as it seems.
Google Analytics is an important tool that helps you to understand how your landing pages are performing. On top of that, it also helps you to track your audiences’ journey along your site and what you can do to optimize your landing pages’ performances.
This blog post will walk you through how you can:
- Monitor a specific landing page’s conversion rate
- Generate a landing page report
- Check out blog posts that are performing (and those that are not)
- Enable you to manage your content strategy
- Discover web pages that are generating the most traffic
- Where new users to your site are coming from, and more!
What Are Landing Pages In A Google Analytics Report?
Simply put, a landing page in Google Analytics is the first page that your visitor or audience lands on.
It can be any page on your site – a help page, a contact page, your home page, or a blog post.
Google Analytics uses Universal Analytics (UA) to crawl and monitor your site content. However, UA will soon be replaced by Google Analytics 4 (GA4) — both options are available in your Google Analytics dashboard.
The steps below in this blog will pertain to both UA and GA4 dashboards.
Locating The Google Analytics Report For Landing Pages
The landing pages report can be found via the sidebar on the left of the Google Analytics interface as shown below.
Firstly, ensure that you have the correct property selected. A property can be a website, a blog, or a mobile application.
Once you’ve done that, navigate to the left sidebar, and go to Behavior >> Site Content >> Landing Pages.
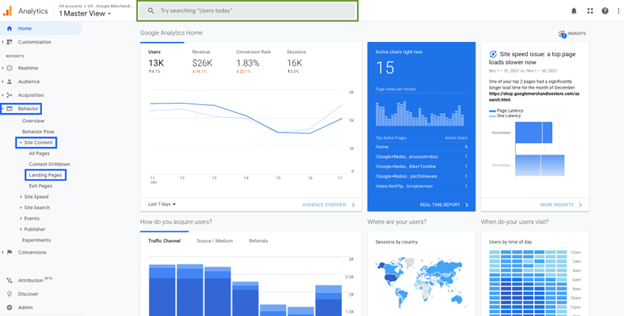
Image from: Hotjar
Important Metrics In Google Analytics Landing Pages Reports
Now that you’re here, what should you be looking out for?
Before you get totally overwhelmed, pay attention to these top 4 important landing page metrics that’ll give you tons of information about your website performance and ideas on how you can continue to optimize your audiences’ user experience. You can access them from the dashboard as shown below.
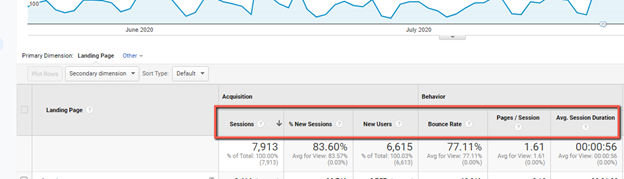
Image from: Raddinteractive
1. Sessions
A session is a full period where users interact with your page within a certain time frame. (It used to be called “hits” on your website.)
Interactions can include viewing your page, giving particulars and subscribing to a newsletter, or even purchasing something from your site.
A user can go in and out multiple times within a session (they’re called ‘visits’).
A single session restarts after 30 minutes of inactivity, or at the stroke of midnight. New sessions start after that.
In the image above, there were 7,913 interactions that took place within a session or a specified time frame.
Why is this metric important?
You can compare session activity between different time frames to know which dates or months are working better for your website, and also when the number of visitors to your page becomes less.
With this information, you’ll be able to prepare for a dip in traffic during certain months and come up with ways to overcome this situation. Simply key in the date ranges that you want
2. New Users
The new users metric helps you to see new visitors (also known as first-time visitors) to your website. If you’re looking to get grow your business and get more leads, or are trying to break into a new market, this will be an important metric to pay attention to.
Why is this metric important?
If the number of new visitors grows on a regular basis (under the New Users tab), it means you’re doing a great job getting more people who didn’t know you before to land on your home page or on your top landing pages.
And if your website landing pages are not gaining new users over time, you’ll be able to plan out what to do and actions to implement so that your website is able to reach new visitors daily.
3. Bounce Rate
A bounce happens when a user lands on your page, and exits without doing any other meaningful interaction, such as clicking on a tab, or a button, or purchasing something from your site. As such, a bounce is also known as a single-page session.
If a user lands on your page, scrolls around, and then exits without clicking on anything else, that is considered a bounce.
A bounce rate is the number of times a user bounces from your website versus the total number of visits or sessions you have had within a specific time frame.
If you had 100 sessions within the hour, and 5 users bounced off your page, then your bounce rate would be 5%.
[Bounce rate = the number of single-page sessions/total sessions]Checking out bounce rates is one of the main objectives when collecting data from your google analytics account.
Why is this metric important?
A bounce rate is an important metric because it gives you an idea of how attractive your landing page is to getting users to take an action (click on a button, visit a link, or further explore other pages).
If you have a high bounce rate, it may mean that something on your landing page (either your copy, design, or theme) is affecting user experience.
A bounce rate of 50-70% is considered standard, and 30-50% is deemed excellent. Anything higher than 70% requires you to step in and fix your landing page because a high bounce rate can significantly impact your website’s performance and sales.
4. Average Session Duration
An average session duration is the average amount of time a user spends on your site in a single session.
Google Analytics benchmarks 2-4 minutes as a good average session duration.
Why is this metric important?
The average session duration metric is a great way to gauge your landing page visitors’ engagement rate on your page. It allows you to predict the performance of your landing page, based solely on how long a user stays on it.
The longer they stay, the higher the chances they purchase, opt-in, submit an email address, join a free trial, or do other actions that you intend for them to take on your site.
The shorter they stay, the higher your bounce rate and the lower your page’s performance will be.
All these metrics help you to analyze your landing page data and do the necessary adjustments to improve user experience and increase conversions.
5. Using Google Search Console
If your website has been linked to Google Search Console, you will also be able to access and get your landing pages report by going to Home >> Acquisition >> Search Console >> Landing Pages.
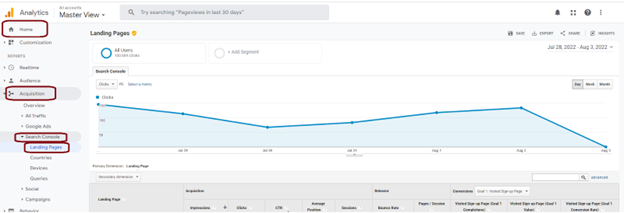
Image from: Watchthem.live
How does Google Analytics compare to Google Search Console?
Well, Google Analytics is more user-focused, showing you how users visit and interact with your site.
On the other hand, Google Search Console is more SEO and search-focused, helping businesses and bloggers aim for better visibility and rank higher on Search Engine Results Pages (SERPs).
Benefits Of Using A Google Analytics Landing Page Report
You’re probably thinking – “Do I really need this? I’m running ads, and my ad campaigns tell me all I need to know.” Or, “I can find out the number of unique visitors on my page daily from my funnel stats.”
Read on to find out why using Google Analytics to measure your landing page’s performance is so much more than that — and how these simple metrics can bring your business or blog to a whole new level.
1. Find Out Your Top Traffic Sources and How People Are Discovering Your Website
If you’re running marketing campaigns and driving traffic to your website, you’ll want to know which ones are working well.
In the Google Analytics landing page reports, you’ll be able to see the main source of your website’s traffic – it may be from Pinterest, Instagram, LinkedIn, Facebook, or other sources of social media.
If you’re running ads to a particular page, you’ll be able to check out the number of page views, and additional metrics such as conversion rates, number of purchases, and more.
You can also check out how well your page is performing when it comes to organic traffic, which is traffic generated from Google search results or a different search engine.
All this additional information aims to allow you to tweak your marketing campaigns where necessary to get better results, more user views, and be able to reach out to more unique visitors.
2. Be Able To Know Your Users Better Via More Customized Reports
A custom report using the segments section of your Google Analytics account allows you to break your user demographic down so you know better who is visiting and interacting with your website.
Segments are subsets of your analytic data. The best way to understand what segments are to treat them as filters.
There are two ways to segment:
- Using the search bar on the upper right corner of your dashboard to filter certain words or phrases. For example, if you only want to check the performance of your blog on your website, simply key in the page title or page path, such as ‘/blog’ in the search bar.
- Using secondary dimensions – sounds complicated, but is actually a simple dropdown option in your data table that allows you to filter the information you want (much like going to Booking.com and filtering what types of hotels you want and if they offer breakfasts and swimming pools). You get the idea.
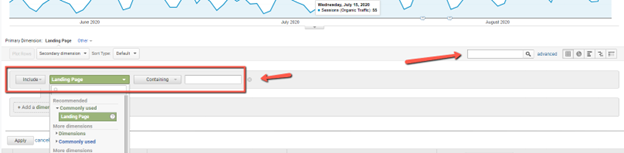
Image from: Raddinteractive
Left arrow refers to secondary dimensions, and the right arrow refers to the search bar.
For example, if you are running both paid and organic campaigns, you can segment these two campaigns to look at the data separately.
You’ll be able to see which campaign is performing better and what types of audiences each campaign is attracting.
If you wish to track whether your users are coming from mobile devices or desktops, segmenting or filtering your data will allow you to create more successful retargeting campaigns.
You can also use segments to break down the demographic data of your audiences. For example, you may find out that your website visitors mostly consist of women between the age of 30 to 55.
You’ll be able to create better campaigns for your target audience, increase the number of users, increase their average time on your page, and generally increase conversions.
3. Quantitative Data For Enhancing Landing Page Performance
Google Analytics landing page reports give you numerical results in terms of sessions, new users, average session duration, and more so you can use these data to optimize your landing page.
The whole goal is to improve user experience results in Google Analytics upon landing on the first page of a session, determine the most popular landing pages on your site and do what you can to reduce bounce rates and increase conversions and sales.
Optimizing Your Landing Pages
Landing pages are basically the first place your users land on when they go to your website. Thus the experience has to be tip-top.
Here are 5 of the best practices for a successful landing page.
1. Mobile Optimized
Your landing page has to work well on mobile, seeing as more than half the traffic on the Internet comes from mobile devices. It will never do to have badly sized images or missing text, or a banner that covers everything else on the screen.
2. Fast Page Load Speed
When you click on a link, you expect to see immediate text and images appear on the screen. Anything that takes more than 2 seconds to load increases bounce rates by double.
3. Clear And Compelling Headline
A headline has to hook them to stay on your page, and a great and supportive subheadline gets them scrolling downwards.
Your headline has to address what it is they want at that point in time, and the subheadline tells them that they can achieve their desires without going through certain pain points.
For example: Get 1K Followers On Instagram In 7 Days (headline)
…without posting or commenting every day (subheadline).
4. Attractive Call To Action Button
A Call To Action (CTA) button gets them to take the action you want them to take, be it signing up for a masterclass, purchasing a digital course, getting a free trial, or more. The aim is to show them the solution to their current desire and how accessible it is — all with the click of a button.
Therefore CTA buttons on your page have to be attractive, strategically positioned throughout the landing page and have a great copy that encourages them to take action.
5. A Great Design
A landing page does not need all sorts of colorful or complicated designs. The design is aimed to enhance the text and the copy, and subtly improve the customer’s journey down your page. It is not meant to take attention away from the copy, unless really necessary.
PS — Check out the 6 Site Design Trends For 2023 here.
Wrapping Up
Google Analytics landing pages report helps you to measure performance, key metrics, and understand your audience’s behavior. You are also able to set proper goals with the data you get, and know your audiences on a deeper level, allowing you to retarget them in future marketing campaigns.
You don’t need to be a marketing expert to learn Google Analytics. Every blogger, entrepreneur, and business will learn it at some point and understand the different metrics discussed above and know how to use these metrics to their advantage.
Couple this data and some awesome landing page design hacks, and you’ve got a winning combination for your business!

Kristy is a pharmacist turned funnel builder. She builds funnels and copywrites for 7 figure businesses. She is also an avid blogger, loves geeking out over SEO and writes regularly for publications on Medium.com. She shares her journey and tips for freelancing at https://kristyting.com.