You’ve come a long way since you first used Facebook to market your business.
Beyond starting your own Facebook Page and sharing regular posts, you have experimented with boosting your posts and have started running your own ads.
But how do you tell if your Facebook marketing and advertising dollars are well spent? Where can you read your advertising performance on Facebook?
This article will walk you through the analytics reporting function in Facebook Ads Manager. It will cover some basics of social media and advertising metrics, and highlight how these indicators can be read.
Before you proceed, do ensure that you are familiar with using the Facebook Ad Creation Tool – from choosing the right Campaign Objectives and building the right Ad Sets to creating the right Facebook Ads.
#1 Measuring Social Media Performance
To measure the performance of your Facebook ads, you first need to understand the concept of a marketing funnel. In the case of a social media customer funnel, it may look like something like this:
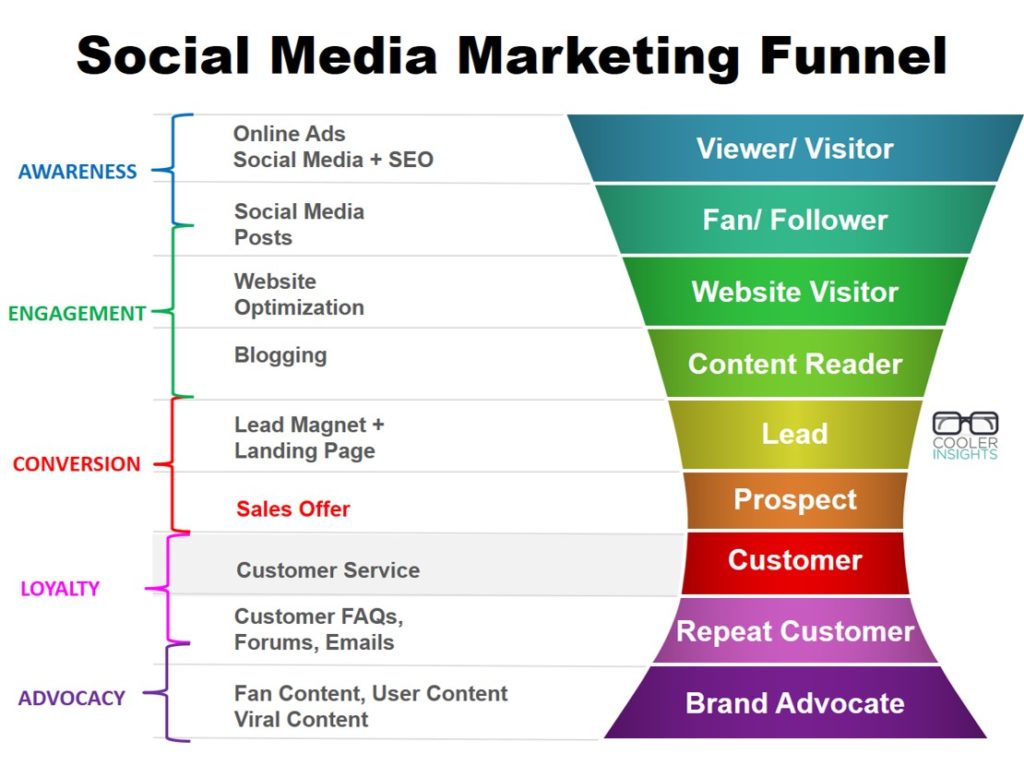
For social media accounts, we can see that there are usually 4 or 5 objectives depending on the customer stage which you’re addressing.
These can be measured via the following analytics and indicators:
- Awareness: page views, impressions, visitors, reach, no of fans/followers, video views (eg 3 secs)
- Engagement/Consideration: likes, comments, shares, clicks, longer video views (eg 30 secs)
- Conversion: opt-ins, sign ups (for events), downloads, subscriptions, and purchases
- Loyalty/Advocacy: shares, retweets, fan blog posts, influencer posts, fan growth
To read some of these Facebook numbers, you can use an analytics tool like Facebook Insights, which will track how well your Facebook page is doing, as well as Google Analytics for the actions taken on your website.
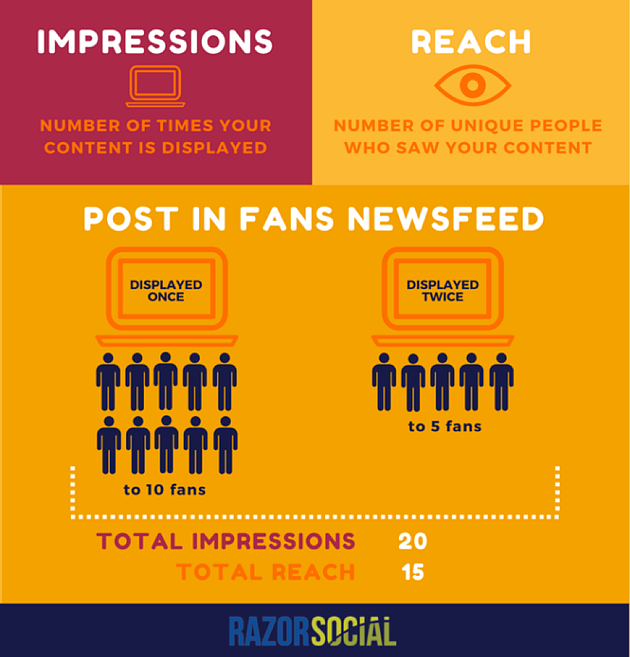
Oh yes, before we proceed, note that Reach and Impressions are slightly different metrics of Awareness. This infographic from Razor Social shows you the difference between the two:
#2 Measuring Facebook Advertising Performance
While the above indicators are useful, what we’re more interested here are the cost effectiveness of the different Facebook ads which we placed. These will help us to gauge how well our ads are performing, and ascertain where we should park more of our marketing funds in.
As there are numerous online advertising metrics used, we will only cover the main ones here.
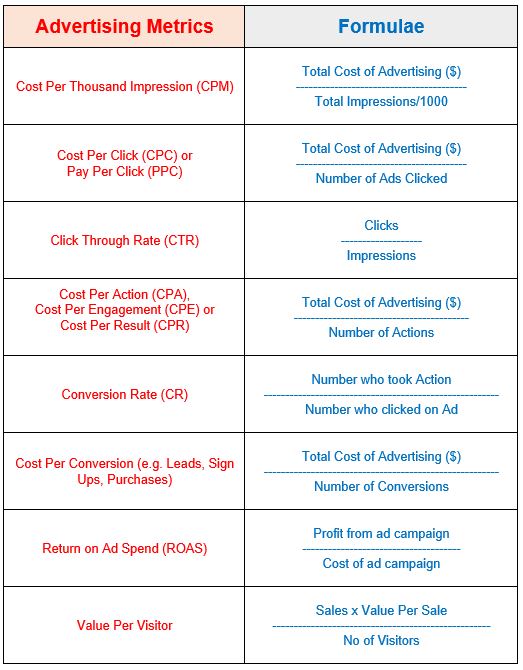
- Cost Per Thousand Impressions (CPM): Measures how much it costs to deliver 1000 impressions. An impression is the point at which an ad is displayed once to a viewer.
- Cost Per Click (CPC): Measures how much it costs to generate one click on the ad.
- Click Through Rate (CTR): Measures percentage of clicks based on impressions served. This shows the effectiveness of the ads in attracting clicks.
- Cost Per Engagement (CPE): Measures how much it costs to generate one engagement (eg likes, clicks, comments, shares).
- Cost Per Result (CPR): Measures how much it costs to generate a result (eg sign ups, video views, reach or others)
- Conversion Rate (CR): Measures percentage of visitors to your website/Facebook post that completes a desired goal (a conversion) out of the total number of visitors
- Cost Per Conversion or Cost Per Acquisition (CPA): Measures how much it costs to acquire a lead, event attendee, customer or sale
- Return On Ad Spend (ROAS): Measures the profit of the campaign as a percentage of its cost
- Value Per Visitor (VPV) or Revenue Per Visitor (RPV): Quantifies amount of money generated each time a customer visits your website
The formulas for these different metrics is summarised in the graph below.
(You can read more about measuring social media marketing ROI in this article.)
#3 Reading Facebook Ads Manager Reports
To analyse how well your campaigns have performed, you can visit your Facebook Ads Manager.
Ads reporting gives you a holistic view of the performance of your ads across Facebook, Instagram and Audience Network. You can customize your analytics data to show the information most important to you.
You can also see the information for your campaigns, ad sets or ads. To see data about specific campaigns, ad sets or ads, check the boxes next to them and then click View. You can change the date range for the data, and sort the information you see by clicking any of the column names (ex: Delivery).
a) Account Overview (Key Analytics)
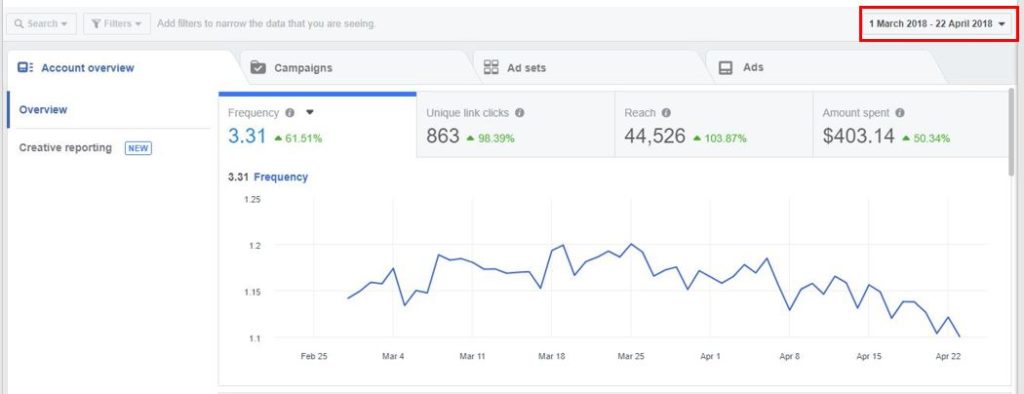
Here, you can see the overall metrics for your ads, sorted by the following:
- Frequency: Average number of times people saw your ads
- Unique link clicks: How many people clicked on your ads
- Reach: The number of people who saw your ads at least once
- Amount spent: How much you have spent on ads during the time period
The green percentages shows an increase compared to the equivalent period before, while red percentages show the decrease compared to the same period before.
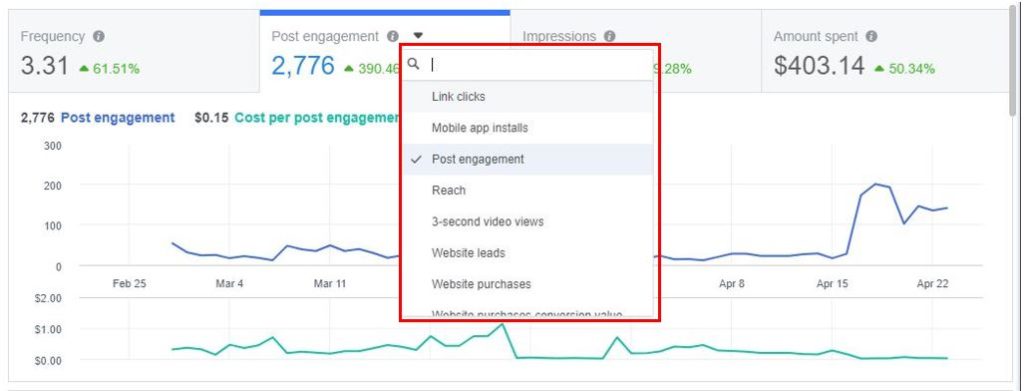
If you wish, you can customise the summary columns here to show your different indicators. In the screen shot here, you can see that the following summary indicators are available:
- Link clicks
- Mobile app installs
- Post engagement
- Reach
- 3-second video views
- Website leads
- Website purchases
- Website purchases conversion value
The same applies to the other tabs which can be toggled to show “Impressions” instead of “Reach”.
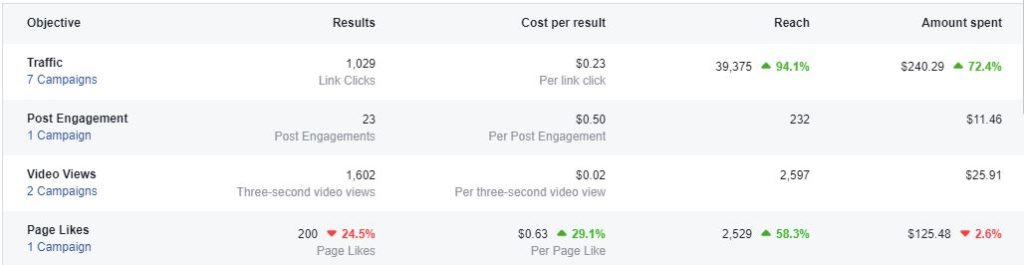
If you scroll below, you’ll also see a summary of the performance for your different campaigns as shown here. The cost per result, reach, and amount spent are also shown here.
You can also see below the respondents to your ads in terms of the age and sex…
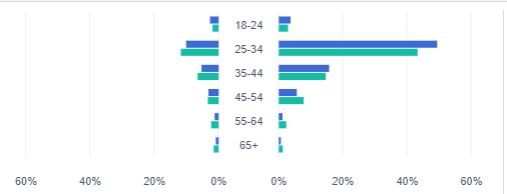
…as well as the times of the best times of the day.
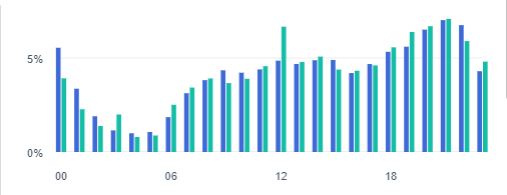
Both charts are extremely useful in helping you to narrow down the timing of your campaigns or the demographic targeting if you wish to do so.
b) Campaign Level Analytics and Results
Here’s how the results are reported at the Campaigns tab. This will be the main metrics that will appear depending on the types of campaign you are running:
- If you’re running an engagement ad to get page likes, you’ll see the number of page likes and cost per like
- If you’re running an ad to get traffic to your website, you’ll see how many link clicks and the cost per link click
- If you’re running a conversion campaign, you’ll see how many conversions and the cost per conversion
- If you’re running a video views campaign, you’ll see how many video views (three-seconds) and the cost per video view
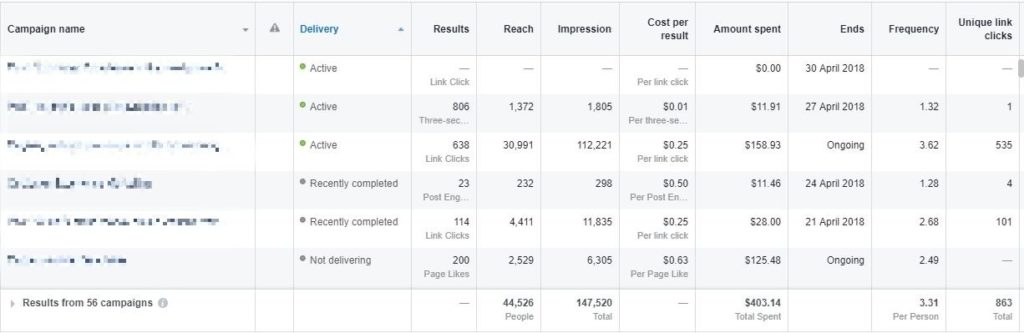
From the above, you can see the following results for the different campaigns run:
- Total Results: eg Link Clicks, Post Engagement, Three-second Video Views, etc
- Reach: Total number of people reached
- Impressions: Total number of impressions delivered (usually higher than reach)
- Cost per Result: May be expressed as Cost Per Engagement, Cost Per Link Click, Cost Per Page Like (for Page Like Ads) and others
- Amount Spent
- Campaign Duration
- Frequency: No of times your ad is seen by your audience
c) Ad Set Level Analytics and Results
Here’s how the Ad Set level results look like.
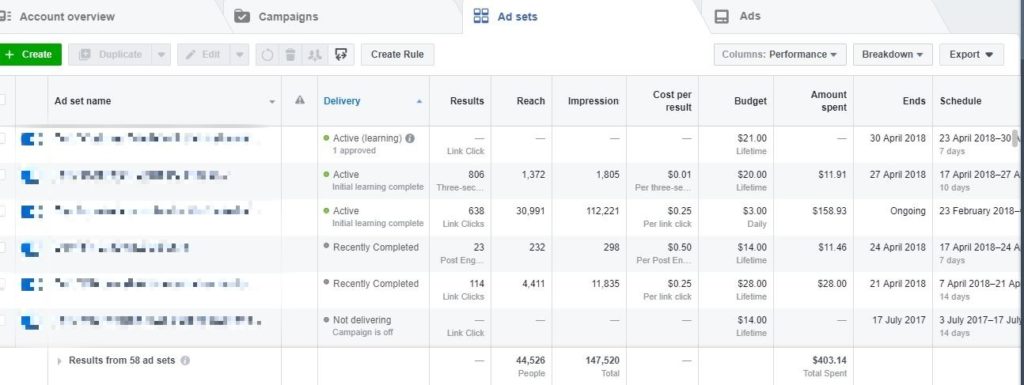
You can see that it looks pretty similar to the Campaign level results except that it is apportioned according to each Ad Set. Thus, if you have a campaign that has multiple ad sets (eg apportioned by different audiences, different optimization strategy, etc), you can see how individual ad sets perform here.
d) Ads Results
If you click on the Ads tab, you can see your ad performance presented in terms of your different ads.
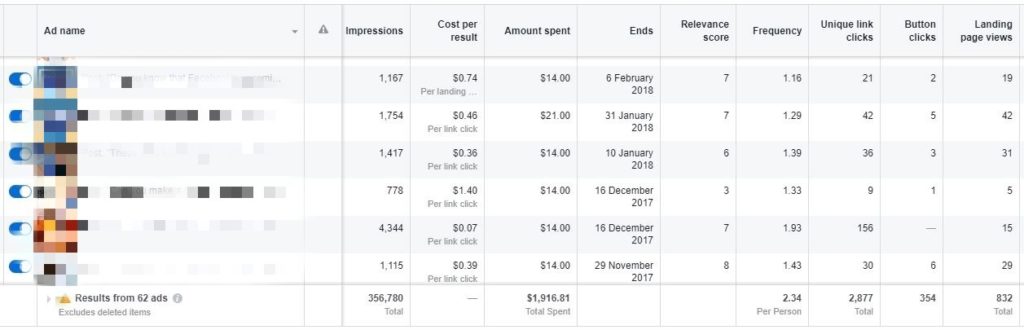
From the above, you can see that the performance metrics looks pretty similar except for the following:
1) Metrics are identified with individual ads. Thus, if you’re running multiple ads using the same ad sets, you will be able to see the performance of each and see which works better for you.
2) You can see a new section called the “Relevance score“. Relevance score is a metric in ads reporting that provides an estimate of how relevant an ad is to its target audience. It is based on how the ad is performing and other factors, including positive feedback (Eg app installs and video views) we expect from the people seeing your ad and negative feedback (Eg someone clicks I don’t want to see this on your ad). When an ad’s relevance score is high, it’s more likely to be shown to your target audience over other ads. You also pay less to reach more of your target audience.
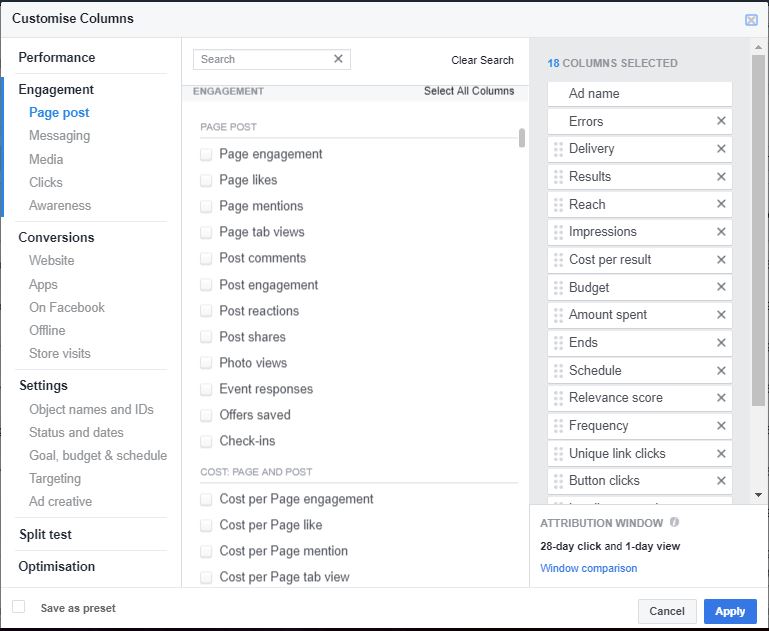
e) Customising Columns
To better present your analytics data in a way that makes sense, you can customise your columns to only show the numbers that matter.
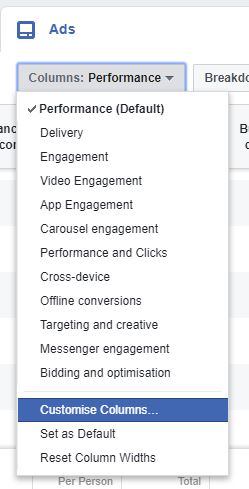
Click on the Columns drop down above your campaign table and select Customize Columns to see specific metrics.
- Performance: Can be customized further to include metrics like results, reach, frequency and impressions.
- Engagement: Can be customized further to show more metrics categories like page post, messaging, media, clicks and awareness.
- Conversions: Can be customized further to include metrics like website conversions, website purchases, cost per website conversion, mobile app installs and mobile app purchases.
- Settings: Can be further customized to include metrics like start date, end date, ad set name, ad ID, delivery, bid and objective
To study why certain ads do better than others, it is useful to customise your columns to focus on the following metrics and data:
- Performance and clicks are useful for traffic and conversion campaigns
- You may wish to include your marketing funnel metrics, ie from impressions, clicks, CTR, leads to sales conversion values. This helps you to compare two ads to see which ones do better at which stage.
- Breakdown your ads according to other indicators like age, gender, country, and other options to see which ones give the best results.
f) Editing Campaigns, Ad Sets and Ads
Before we go, there is one last very important thing about Ads Manager. Namely this…
You can modify your campaigns, ad sets and ads midway during your campaign!
Now you should do so only if you determine that something needs to be tweaked. Here’s what you should do (content taken from Facebook.)
Editing Campaigns
You can change your campaign name and apply a campaign spending limit when editing at the campaign level.
- Click the Campaigns tab.
- Check the boxes next to each campaign you want to edit.
- Click Edit and a side panel will open where you can make edits to your campaign name or apply a spending limit.
Changing Ad Sets
For ad sets, you can edit your ad set name, audience, budget, schedule and delivery choices.
- Click the Ad Sets tab.
- Check the boxes next to each ad set you want to edit.
- Click Edit and a side panel will open where you can make edits.
You can then edit:
-
Ad Set Name: Rename the ad sets.
-
Budget & Schedule: Click Adjust Budget to edit your ad set budget by either a dollar amount or a percentage. You can also change the ad scheduling to make your ads run all the time or run ads on a schedule (for lifetime budgets only). You can’t adjust multiple ad sets with a mix of daily and lifetime budgets.
-
Audience: Change your audience targeting. If you select multiple ad sets with different saved audiences, editing the audiences creates a new audience.
-
Optimization & Delivery: Change what you’re optimizing for or your bidding strategy.
Changing Ads
At the ad level, you can change your ad creative: headline, text, image and call to action.
- Click the Ads tab
- Check the boxes next to each ad you want to edit.
- Click Edit and a side panel will open where you can make edits.
Conclusion
Phew! That was quite a lot to go through wasn’t it?
I hope that this article has been useful for you to understand how you can read the results of your Facebook Ads, customise how they are presented, and tweak your campaigns, ad sets and ads midway to improve their performance.
For the next articles in the series, we will look at more Facebook advertising ninja strategies to help you improve your game.
More in My Social Media Marketing Course
Wish to learn the details of how you do the above, and a whole lot more? Sign up for my social media marketing course.
Learn a 6-step process for social media marketing campaigns in a rigorous two-day training course which will bring your social media efforts to life.